|
pitch analysis by filtered autocorrelation
|
|
A command that creates a Pitch object from every selected Sound object.
Purpose
to perform a pitch analysis based on the autocorrelation of the low-pass filtered signal.
Usage
Filtered autocorrelation is the pitch analysis method of choice if you want to measure intonation or vocal-fold vibration frequency. See how to choose a pitch analysis method for details.
Algorithm
This command will first low-pass filter the signal, then apply pitch analysis by raw autocorrelation on the filtered signal.
The low-pass filter is Gaussian in the frequency domain. If, for instance, you set the pitch top to 800 Hz, and the attenuation at top to 0.03, then the attenuation at 400 Hz is the fourth root of 0.03, i.e. about 42%. As a function of frequency f, the attenuation is 0.03(f/800)². Here’s a table of attenuation factors, also in dB (in this logarithmic domain, the shape is parabolic):
| frequency | attenuation | logarithmic |
Note: the attenuation curve will be identical to the curve shown here if you use a pitch top of 500 Hz and an attenuation at top of 0.25; however, this is not advised, because the example table provides a more gradual suppression of higher pitches, almost as if there were no pitch top at all.
Settings
Several settings are already described in Intro 4.2. Configuring the pitch contour. The explanations below assume that you have gone through that part of the Intro.
The settings that control the recruitment of the candidates are:
- Time step (s) (standard value: 0.0)
- the measurement interval (frame duration), in seconds. If you supply 0, Praat will use a time step of 0.75 / (pitch floor), e.g. 0.015 seconds if the pitch floor is 50 Hz; in this example, Praat computes 66.7 pitch values per second.
- Pitch floor (Hz) (standard value: 50 Hz)
- candidates below this frequency will not be recruited. This parameter determines the effective length of the analysis window: it will be 3 longest periods long, i.e., if the pitch floor is 50 Hz, the window will be effectively 3/50 = 0.06 seconds long.
Note that if you set the time step to zero, the analysis windows for consecutive measurements will overlap appreciably: Praat will always compute 4 pitch values within one window length, i.e., the degree of oversampling is 4.
- Pitch top (Hz) (standard value: 800 Hz)
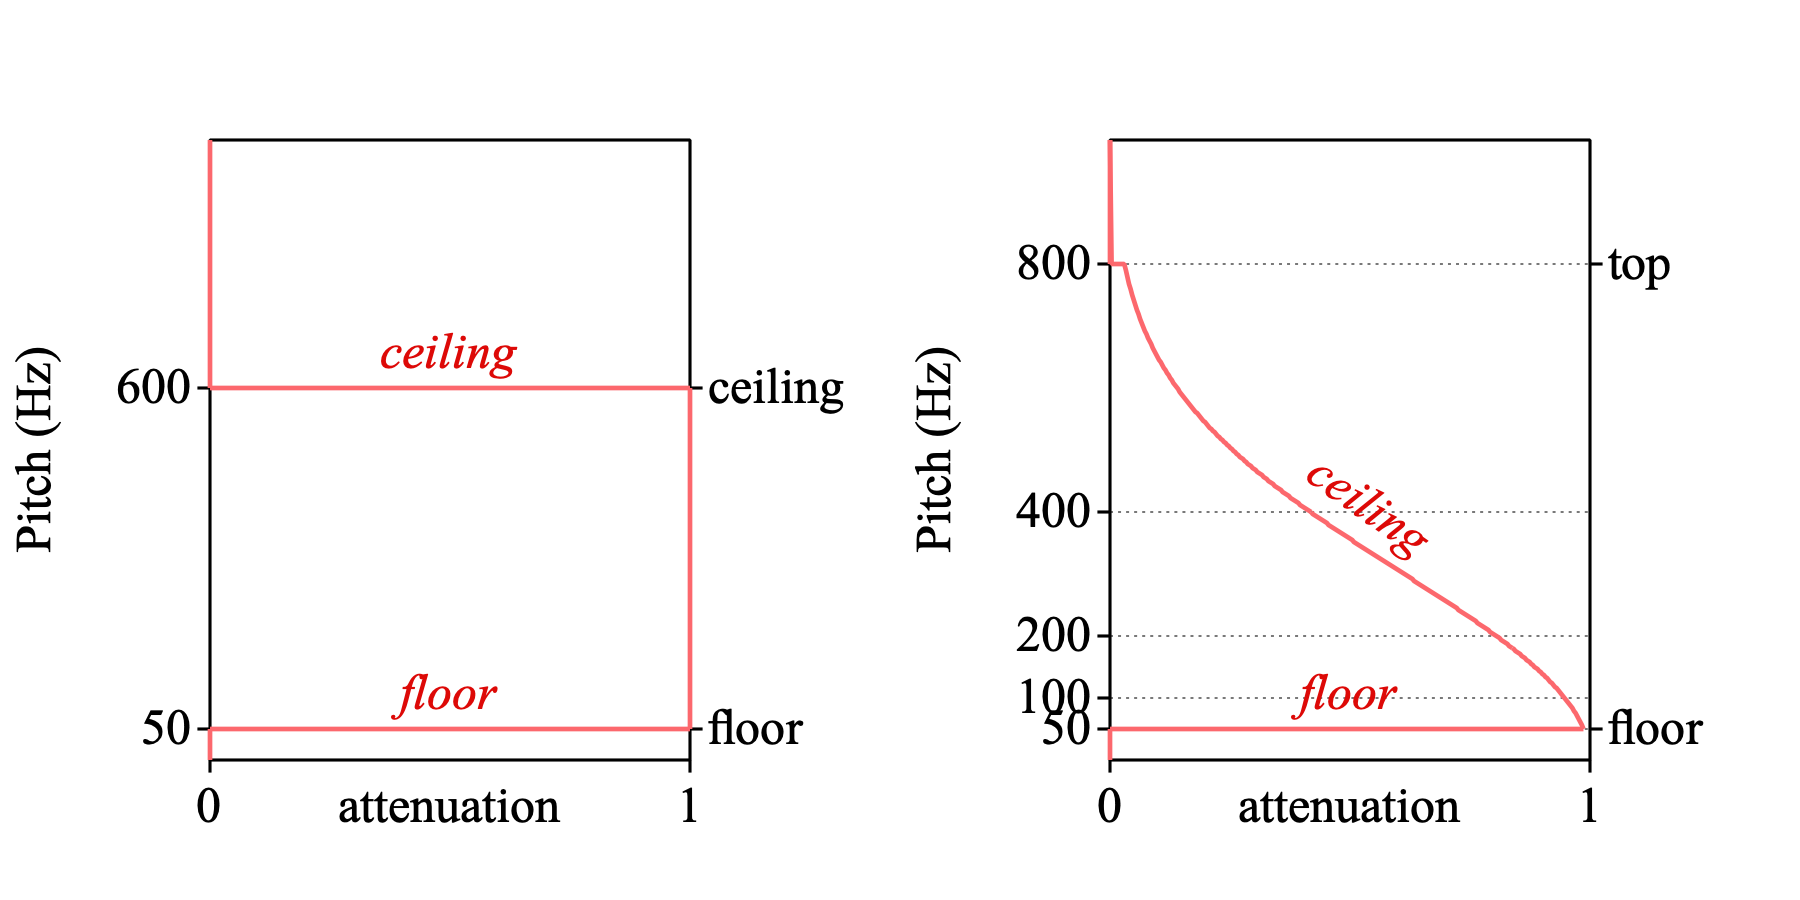
- candidates above this frequency will be ignored. Note, however, that candidates around one half of this (i.e. 400 Hz) will already be reduced by 7.6 dB, i.e. they are already moderately disfavoured, and that candidates around three-quarters of this (i.e. 600 Hz) will already be reduced by 17.1 dB, i.e. they are strongly disfavoured. Hence, the pitch top needs to be be set much higher than the pitch ceiling of raw autocorrelation, which is why the standard is 800 Hz whereas the standard for raw autocorrelation can be 500 or 600 Hz. To illustrate this, consider the search space for raw autocorrelation on the right (with a ceiling of 600 Hz) and the search space for filtered autocorrelation on the right (with a top of 800 Hz):

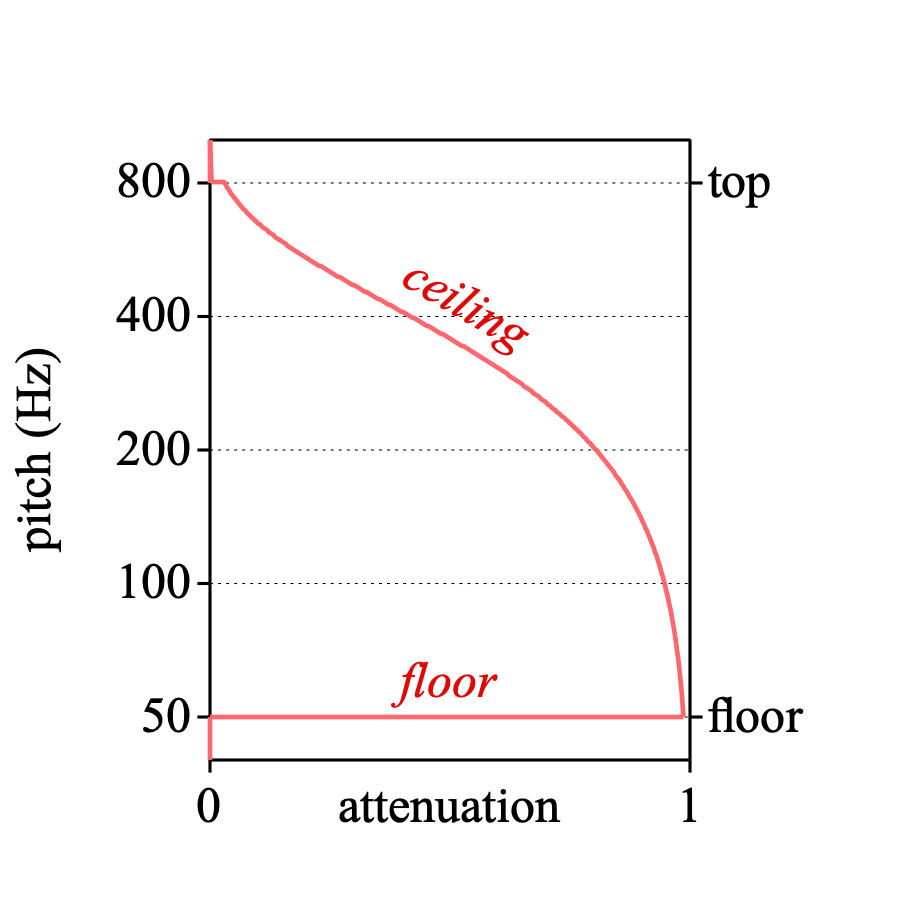
- Because of the reduction in strength of high pitch candidates, it may be preferable to view pitch on a logarithmic pitch scale, so that the suppressed top octave (from 400 to 800 Hz) occupies less space:

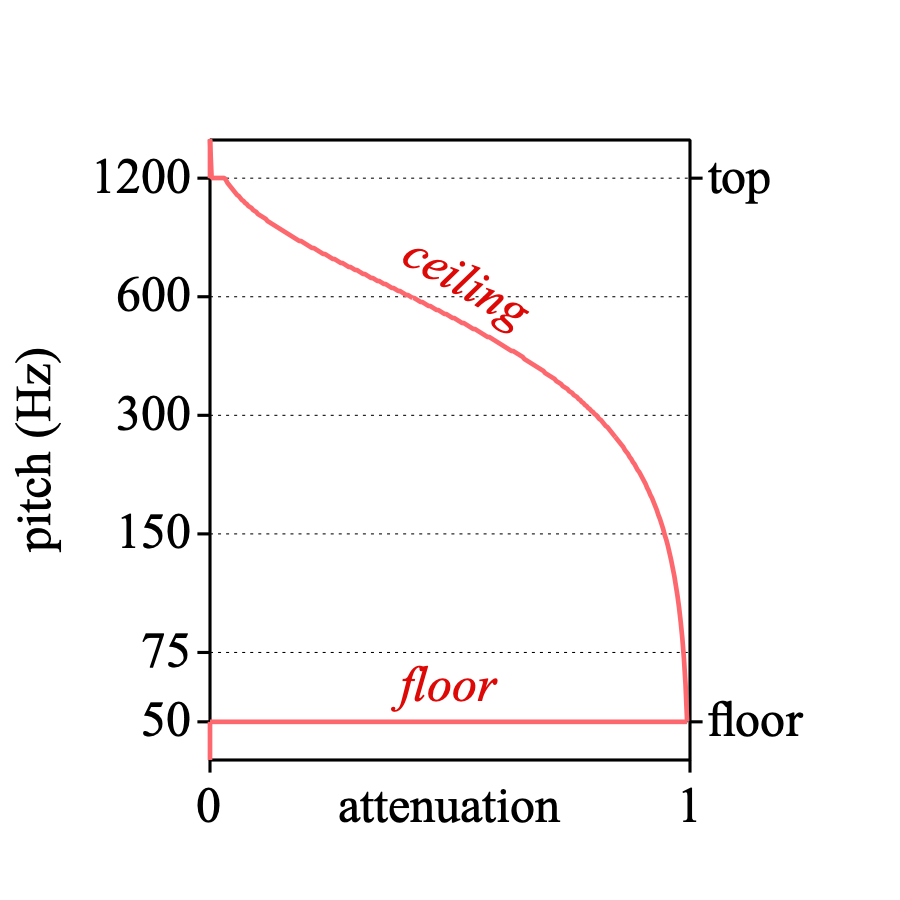
We could say that the whole range from 300 to 800 Hz can be regarded as a skewed “ceiling”. This is why we distinguish between the terms “ceiling” and “top”. If you have a speaker with an especially high F0, then you can raise the top to e.g. 1200 Hz; the attenuation of higher candidates will then have the exact same shape:

- Max. number of candidates (standard value: 15)
- each frame will contain at least this many pitch candidates. One of them is the “unvoiced candidate”; the others correspond to time lags over which the signal is more or less similar to itself.
- Very accurate (standard value: off)
- if off, the window is a Hanning window with a physical length of 3 / (pitch floor). If on, the window is a Gaussian window with a physical length of 6 / (pitch floor), i.e. twice the effective length.
A pre-processing algorithm filters the sound before the pitch analysis by raw autocorrelation begins. The shape of the attenutation curve is determined not only by the height of the pitch top (in hertz), but also by how wide it is (in the pictures above, it’s the tiny horizontal linepiece at the top):
- Attenuation at top (standard value: 0.03)
- this is how much the frequency components of the original sound have been attenuated at the top. In the example table above, you can see that at the top (800 Hz) the sounds was attenuated by a factor of 0.03. We known of no reasons to change this value, except for experimenting.
A post-processing algorithm seeks the cheapest path through the candidates. The settings that determine the cheapest path are:
- Silence threshold (standard value: 0.09)
- frames that do not contain amplitudes above this threshold (relative to the global maximum amplitude), are probably silent.
- Voicing threshold (standard value: 0.50)
- the strength of the unvoiced candidate, relative to the maximum possible autocorrelation. If the amount of periodic energy in a frame is more than this fraction of the total energy (the remainder being noise), then Praat will prefer to regard this frame as voiced; otherwise as unvoiced. To increase the number of unvoiced decisions, increase the voicing threshold.
- Octave cost (standard value: 0.055 per octave)
- degree of favouring of high-frequency candidates, relative to the maximum possible autocorrelation. This is necessary because even (or: especially) in the case of a perfectly periodic signal, all undertones of F0 are equally strong candidates as F0 itself. To more strongly favour recruitment of high-frequency candidates, increase this value.
- Octave-jump cost (standard value: 0.35)
- degree of disfavouring of pitch changes, relative to the maximum possible autocorrelation. To decrease the number of large frequency jumps, increase this value. In contrast with what is described in the article (Boersma (1993)), this value will be corrected for the time step: multiply by 0.01 s / TimeStep to get the value in the way it is used in the formulas in the article.
- Voiced / unvoiced cost (standard value: 0.14)
- degree of disfavouring of voiced/unvoiced transitions, relative to the maximum possible autocorrelation. To decrease the number of voiced/unvoiced transitions, increase this value. In contrast with what is described in the article, this value will be corrected for the time step: multiply by 0.01 s / TimeStep to get the value in the way it is used in the formulas in the article.
The standard settings are best in most cases. For some pathological voices, you will want to set the voicing threshold to much less than the standard of 0.50, in order to get pitch values even in irregular parts of the signal. For prevoiced plosives, you may want to lower the silence threshold from 0.09 to 0.01 or so.
Availability in Praat
Pitch analysis by filtered autocorrelation is available in two ways in Praat:
- • via Sound: To Pitch (filtered autocorrelation)... from the Analyse periodicity menu in the Objects window when you select a Sound object;
- • via Show Pitch and Pitch analysis method is filtered autocorrelation from the Pitch menu when you are viewing a Sound or TextGrid object (SoundEditor, TextGridEditor).
Links to this page
© Paul Boersma 2023,2024


