|
Pitch analysis is the determination of a pitch curve from a given sound.
In Praat you can choose from at least four methods for pitch analysis:
These method have been listed here in order of usefulness for the average speech researcher: for measuring vocal-fold vibration frequency or intonation, you are advised to use filtered autocorrelation; for voice analysis (such as is used in the area of voice pathology), you are advised to use raw cross-correlation; and for measuring pure periodicity, you are advised to use raw autocorrelation.
From 1993 to 2023, Praat’s preferred method for measuring intonation (and for most use cases involving vocal-fold vibration) was raw autocorrelation, and this is still available if you want to measure raw periodicity (see below). From 2023 on, Praat’s preferred method for measuring intonation (and for most use cases involving vocal-fold vibration) has been filtered autocorrelation.
All these methods measure pitch in terms of the self-similarity of the waveform. If the waveform is almost identical if you shift it by 10 milliseconds in time, then 100 Hz will be a good candidate for being the F0. This idea has been used in Praat from 1993 on, using the "autocorrelation" and "cross-correlation" methods, which are nowadays called "raw autocorrelation" and "raw cross-correlation". Both methods measure self-similarity as a number between -1.0 and +1.0. From 2023 on, we also have "filtered autocorrelation" and "filtered cross-correlation", which use low-pass filtering of the waveform (by a Gaussian filter) prior to doing autocorrelation or cross-correlation.
The filtering comes with several benefits:
On a database containing EGG recordings as a gold standard (AtakeDB), the incidence of unwanted big frequency drops falls from 0.54 (of voiced frames) for raw AC to 0.15 for filtered AC, and the number of unwanted big frequency rises falls from 0.25 to 0.10 (of voiced frames); together, these numbers indicate that the incidence of gross frequency errors is better for filtered AC than for raw AC by a factor of more than 3.
On the other hand, low-pass filtering also produces potentially unwanted side effects:
All in all, it seems likely that filtered AC works better in practice than raw AC (your feedback is invited, though), which is why filtered AC is the preferred pitch analysis method for vocal-fold vibration and intonation, as is shown in the Periodicity menu in the Objects window, in the Pitch menu of the Sound window, and in many places in this manual. While the standard pitch range for raw AC runs from 75 to 600 Hz, filtered AC has less trouble discarding very low or very high pitch candidates, so the standard pitch range for filtered AC is wider, running from 50 Hz to 800 Hz, and may not have to be adapted to the speaker’s gender.
For voice analysis, we probably shouldn’t filter away noise, so raw cross-correlation is the preferred method.
The high standard “silence threshold” of 0.09 for filtered AC (or, to a lesser extent, 0.03 for raw AC) probably leads to trouble measuring voicing during the closure phase of prevoiced plosives such as [b] or [d]. You are still advised to use filtered AC, but to lower the silence threshold to 0.01 or so.
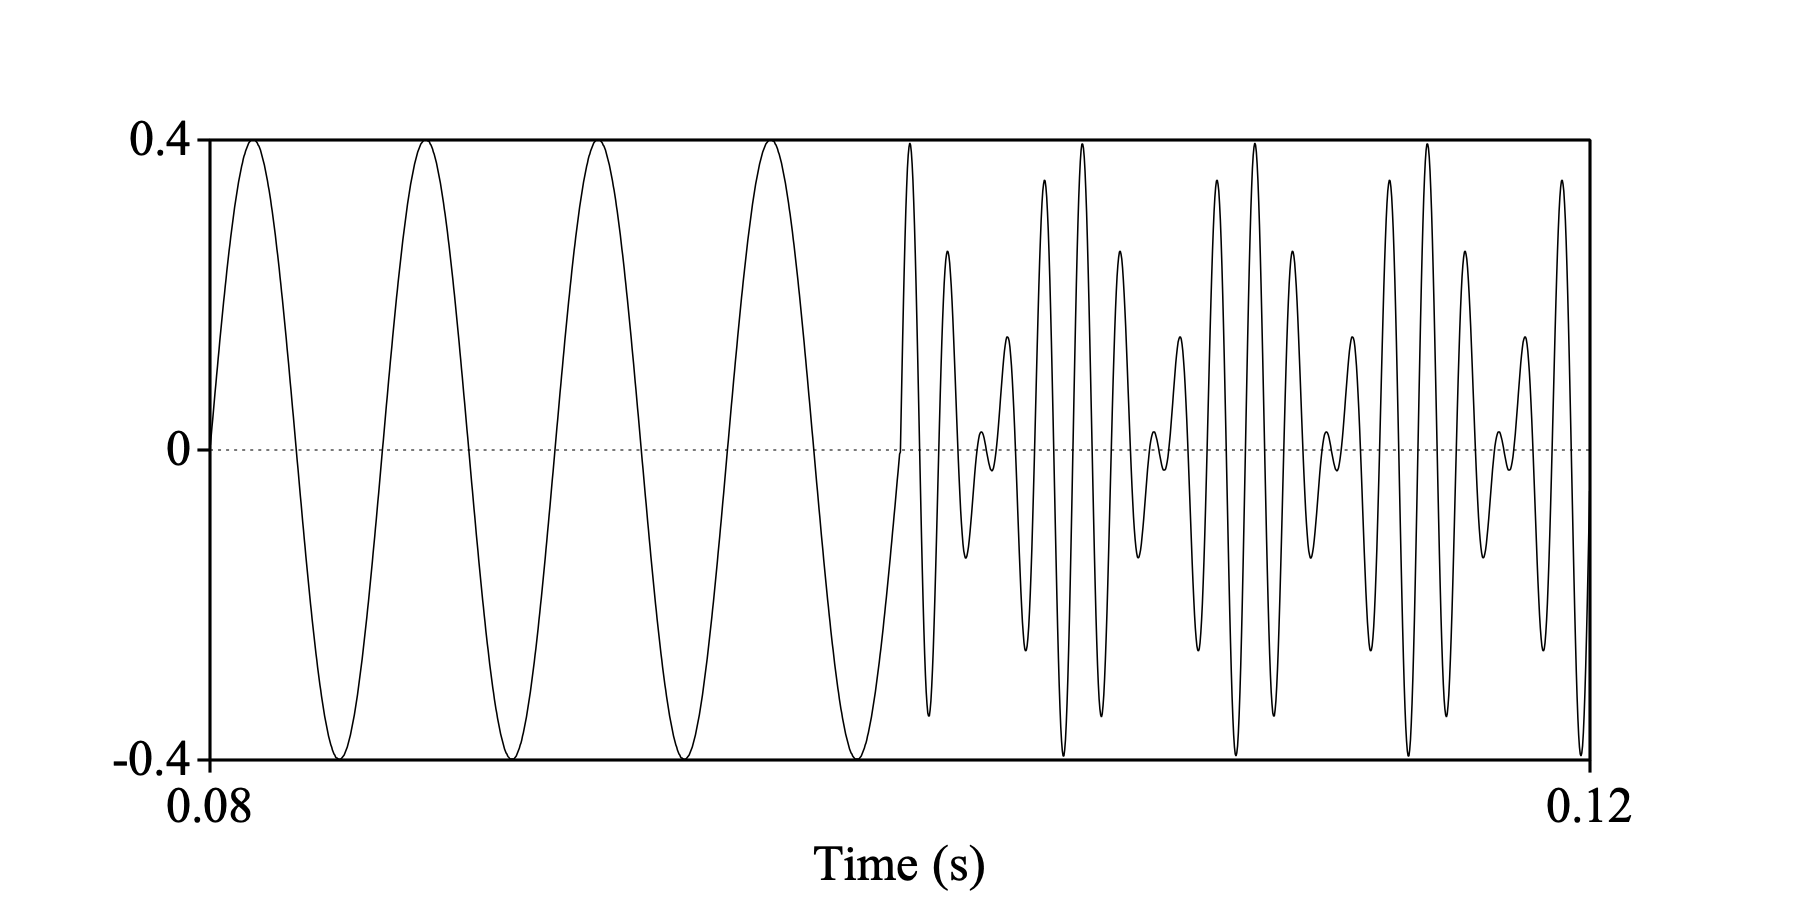
Mathematically generated periodic signals aren’t necessarily speechlike. For instance:
sine = Create Sound from formula: "sine", 1, 0, 0.1, 44100, "0.4*sin(2*pi*200*x)"
tricky = Create Sound from formula: "tricky", 1, 0, 0.1, 44100, "0.001*sin(2*pi*400*x)
... + 0.001*sin(2*pi*600*x) - 0.2*cos(2*pi*800*x+1.5) - 0.2*cos(2*pi*1000*x+1.5)"
selectObject: sine, tricky
Concatenate
Erase all
Draw: 0.08, 0.12, 0, 0, "yes", "curve"

Both the left part of this sound and the right part have a period of 5 ms, and therefore an F0 of 200 Hz. The raw autocorrelation method measures an equally strong pitch of 200 Hz throughout this signal, while filtered autocorrelation considers the right part voiceless. This is because the right part contains only components at 800 and 1000 Hz, which will be filtered out by the low-pass filter, and only very small components at 200, 400 or 600 Hz. This problem of the missing fundamental was the reason why low-pass filtering was not included in raw autocorrelation in 1993. However, this situation is very rare in speech, so for speech we do nowadays recommend filtered autocorrelation, while we recommend raw autocorrelation only if you want to measure raw periodicity.
© Paul Boersma 2023,2024