|
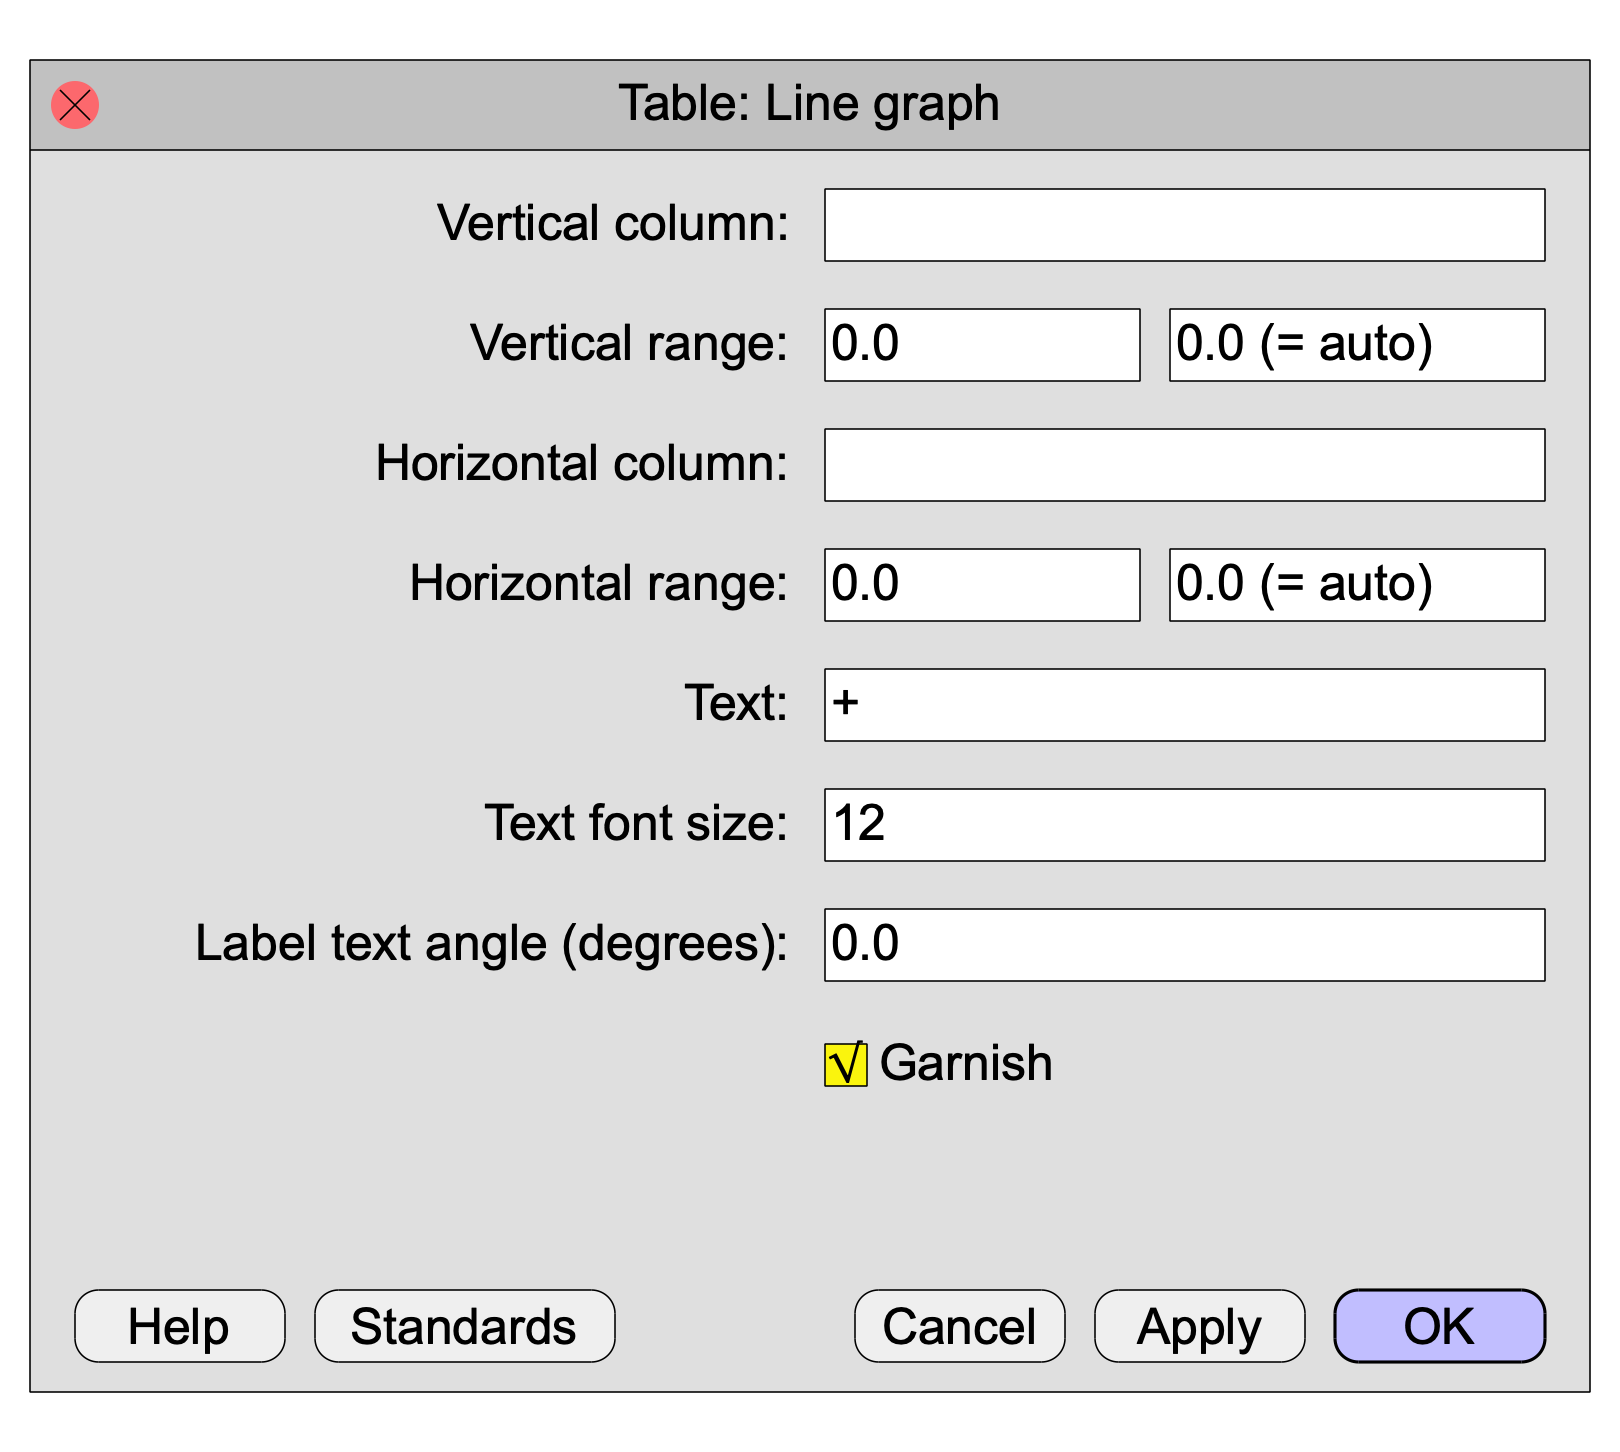
Draws a line graph from the data in a column of the selected Table. In a line plot, the horizontal axis can have a nominal scale or a numeric scale. The data points are connected by line segments.
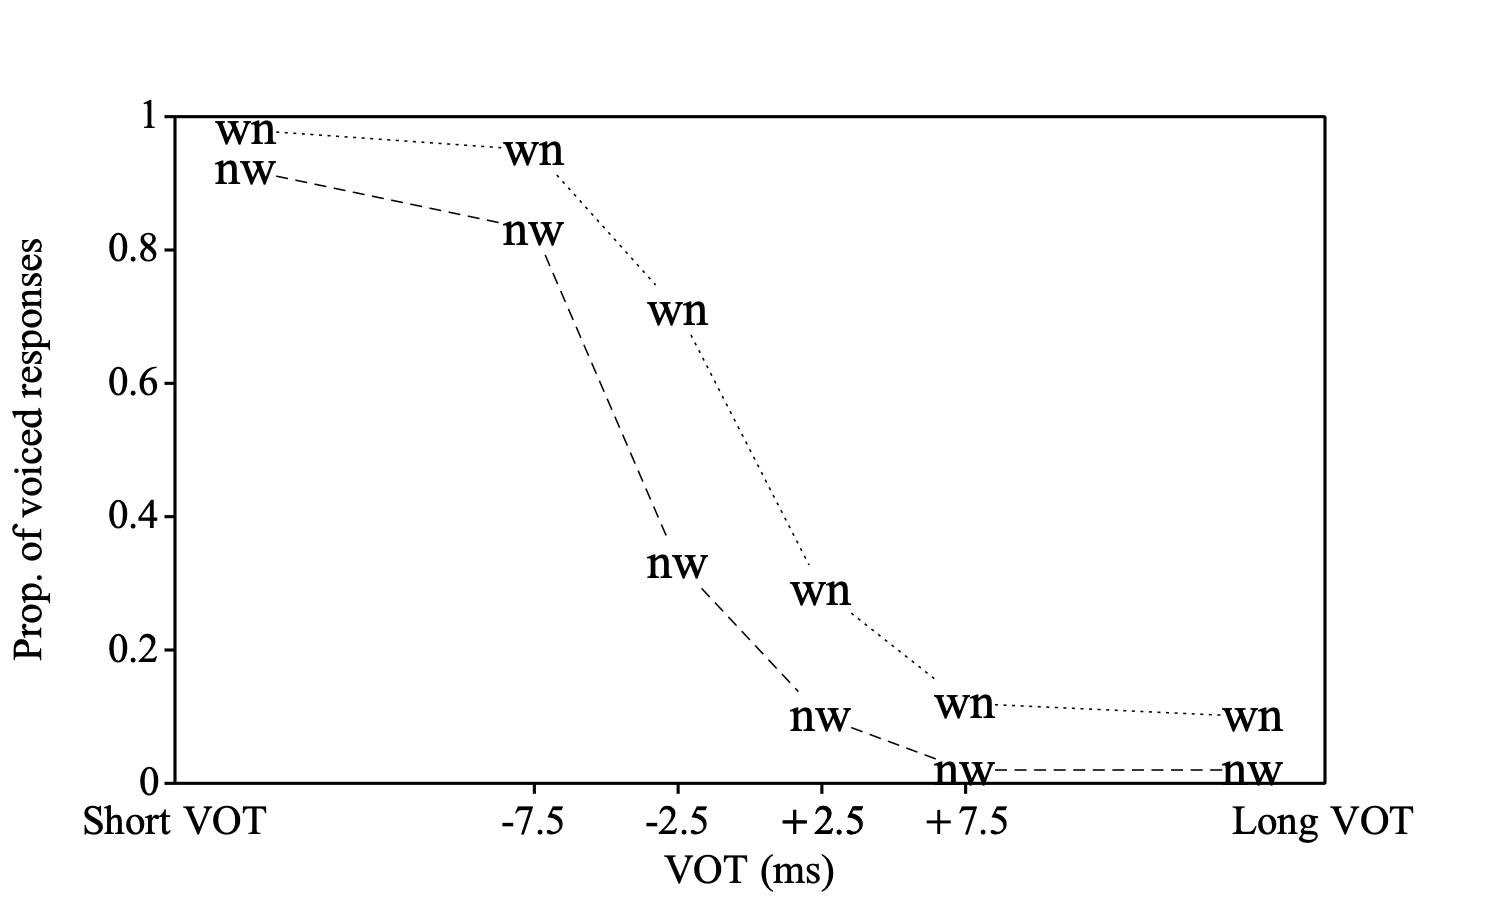
The following table was estimated from fig. 3 in Ganong (1980) and represents the fraction /d/ responses as a function of a voice onset time (VOT) continuum. The second column shows the responses in a word - nonword continuum, while the third column shows the responses to a nonword - word continuum.
VOT dash-tash dask-task
-17.5 0.98 0.92
-7.5 0.95 0.83
-2.5 0.71 0.33
2.5 0.29 0.10
7.5 0.12 0.02
17.5 0.10 0.02
We can reproduce fig. 3 from Ganong (1980) with the following script, where we labeled the word - nonword curve with "wn" and the nonword - word curve with "nw". We deselect "Garnish" because we want to put special marks at the bottom.
Font size: 10
Dotted line
Line graph: "dash-tash", 0, 1, "VOT", -20, 20, "wn", 12, 0, "no"
Dashed line
Line graph: "dask-task", 0, 1, "VOT", -20, 20, "nw", 12, 0, "no"
Draw inner box
One mark bottom: 2.5, "no", "yes", "no", "+2.5"
One mark bottom: -2.5, "yes", "yes", "no", ""
One mark bottom: -7.5, "yes", "yes", "no", ""
One mark bottom: 7.5, "no", "yes", "no", "+7.5"
One mark bottom: 2.5, "no", "no", "no", "+2.5"
One mark bottom: -20, "no", "no", "no", "Short VOT"
One mark bottom: 20, "no", "no", "no", "Long VOT"
Text bottom: 1, "VOT (ms)"
Marks left every: 1, 0.2, "yes", "yes", "no"
Text left: 1, "Prop. of voiced responses"
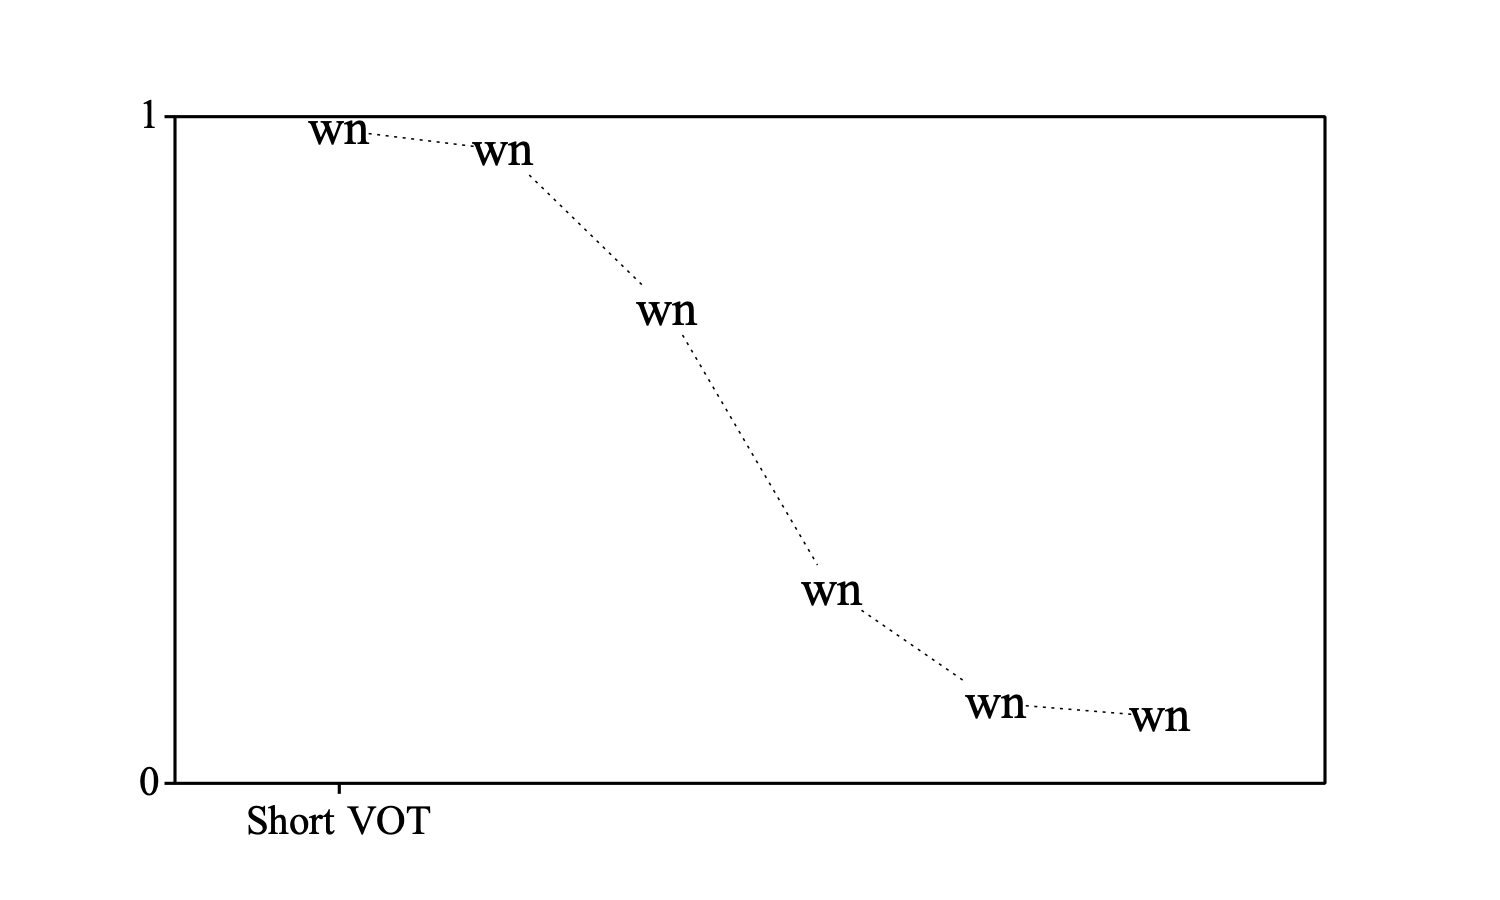
As an example of what happens if you don't supply an argument for the "Horizontal column" we will use the same table as for the previous plot. However the resulting plot may not be as meaningful (note that the horizontal nominal scale makes all points equidistant in the horizontal direction.)
Dotted line
Line graph: "dash-tash", 0, 1, "", 0, 0, "wn", 12, 0, "yes"
One mark bottom: 1, "no", "yes", "no", "Short VOT"
© djmw 20231207