|
PowerCepstrum: Draw trend line...
|
|
Draws the line that models the background of the selected PowerCepstrum.
Settings
- Quefrency range (s)
- define the extrema on the horizontal scale of the picture.
- Amplitude range (dB)
- define the extrema on the vertical scale of the picture
- Trend line quefrency range (s)
- the quefrency range for which the amplitudes (in dB) will be modelled by a straight line. In Hillenbrand et al. (1994), the lower value for this range was chosen as 0.001 s in order to reduce the effect of very low quefrency data on the straight line fit. In our analysis this value is not so critical if we use the robust fitting procedure. If you choose the "Least squares" fit method then it matters more.
- Trend type
- defines how to model the cepstrum background. We can model it with a straight line as was done in Hillenbrand et al. (1994). The slope of this line will generally be negative because the background amplitudes get weaker for higher quefrencies. Or, we could use an exponential model in which the background cepstral amplitudes decay in a non-linear fashion.
- Fit method
- defines how the line that models the cepstrum background is calculated. The default method, "Robust slow", corresponds to Theil's robust line fit. The "Robust" method corresponds to the incomplete theil regression and is computationally faster but somewhat less precise. To be compatible with the past, a standard least squares line fit can also be chosen but it is much less precise than the other two because a least squares fit is much more influenced by the peak cepstral values than the other two.
Examples
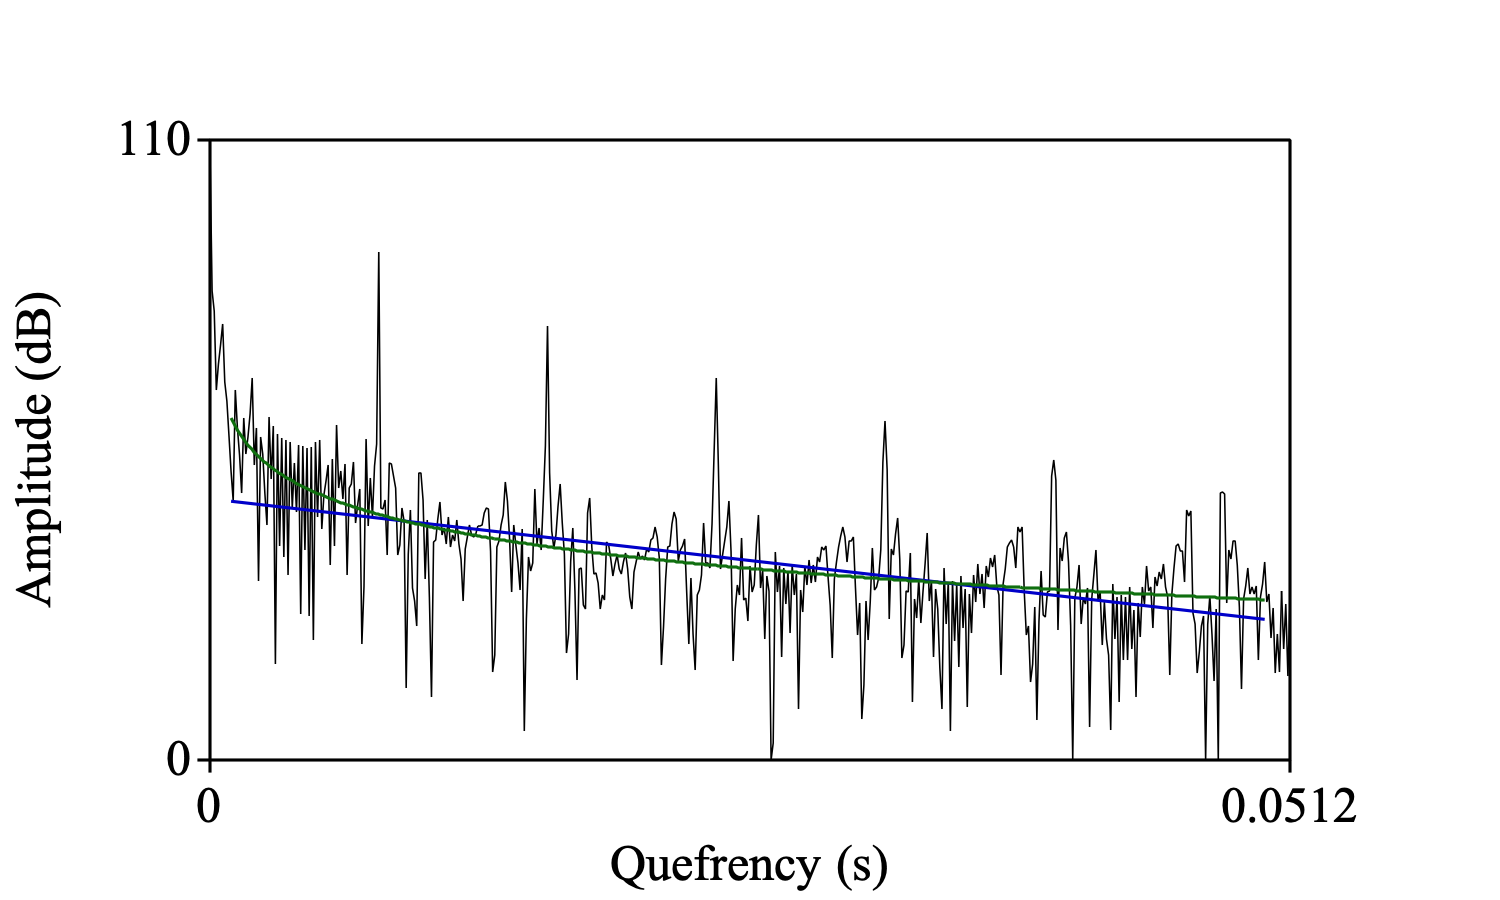
The next picture shows a PowerCepstrum with two drawn trend lines, a straight line in blue and an exponential decay line in green. The picture was generated by the following script. Note that the first four lines in the script are only necessary to generate a PowerCepstrum of a part of a vowel.
Create KlattGrid from vowel: "a", 0.3, 125, 800, 80, 1200, 80, 2300, 100, 2800, 0.1, 1000
To Sound
To PowerCepstrogram: 60, 0.002, 5000, 50
To PowerCepstrum (slice): 0.1
Draw: 0, 0, 0, 110, "yes"
Colour: "Blue"
Draw trend line: 0, 0, 0, 110, 0.001, 0.05, "Straight", "Robust slow"
Colour: "Green"
Draw trend line: 0, 0, 0, 110, 0.001, 0.05, "Exponential decay", "Robust slow"
Colour: "Black"
© djmw 20191008