|
PowerCepstrum: Get peak prominence...
|
|
Calculates the cepstral peak prominence measure (CPP) as defined by Hillenbrand et al. (1994)
The CPP measure is the difference in amplitude between the cepstral peak and the corresponding value on the trend line that is directly below the peak (i.e., the predicted magnitude for the quefrency at the cepstral peak). The CPP measure represents how far the cepstral peak emerges from the cepstrum background.
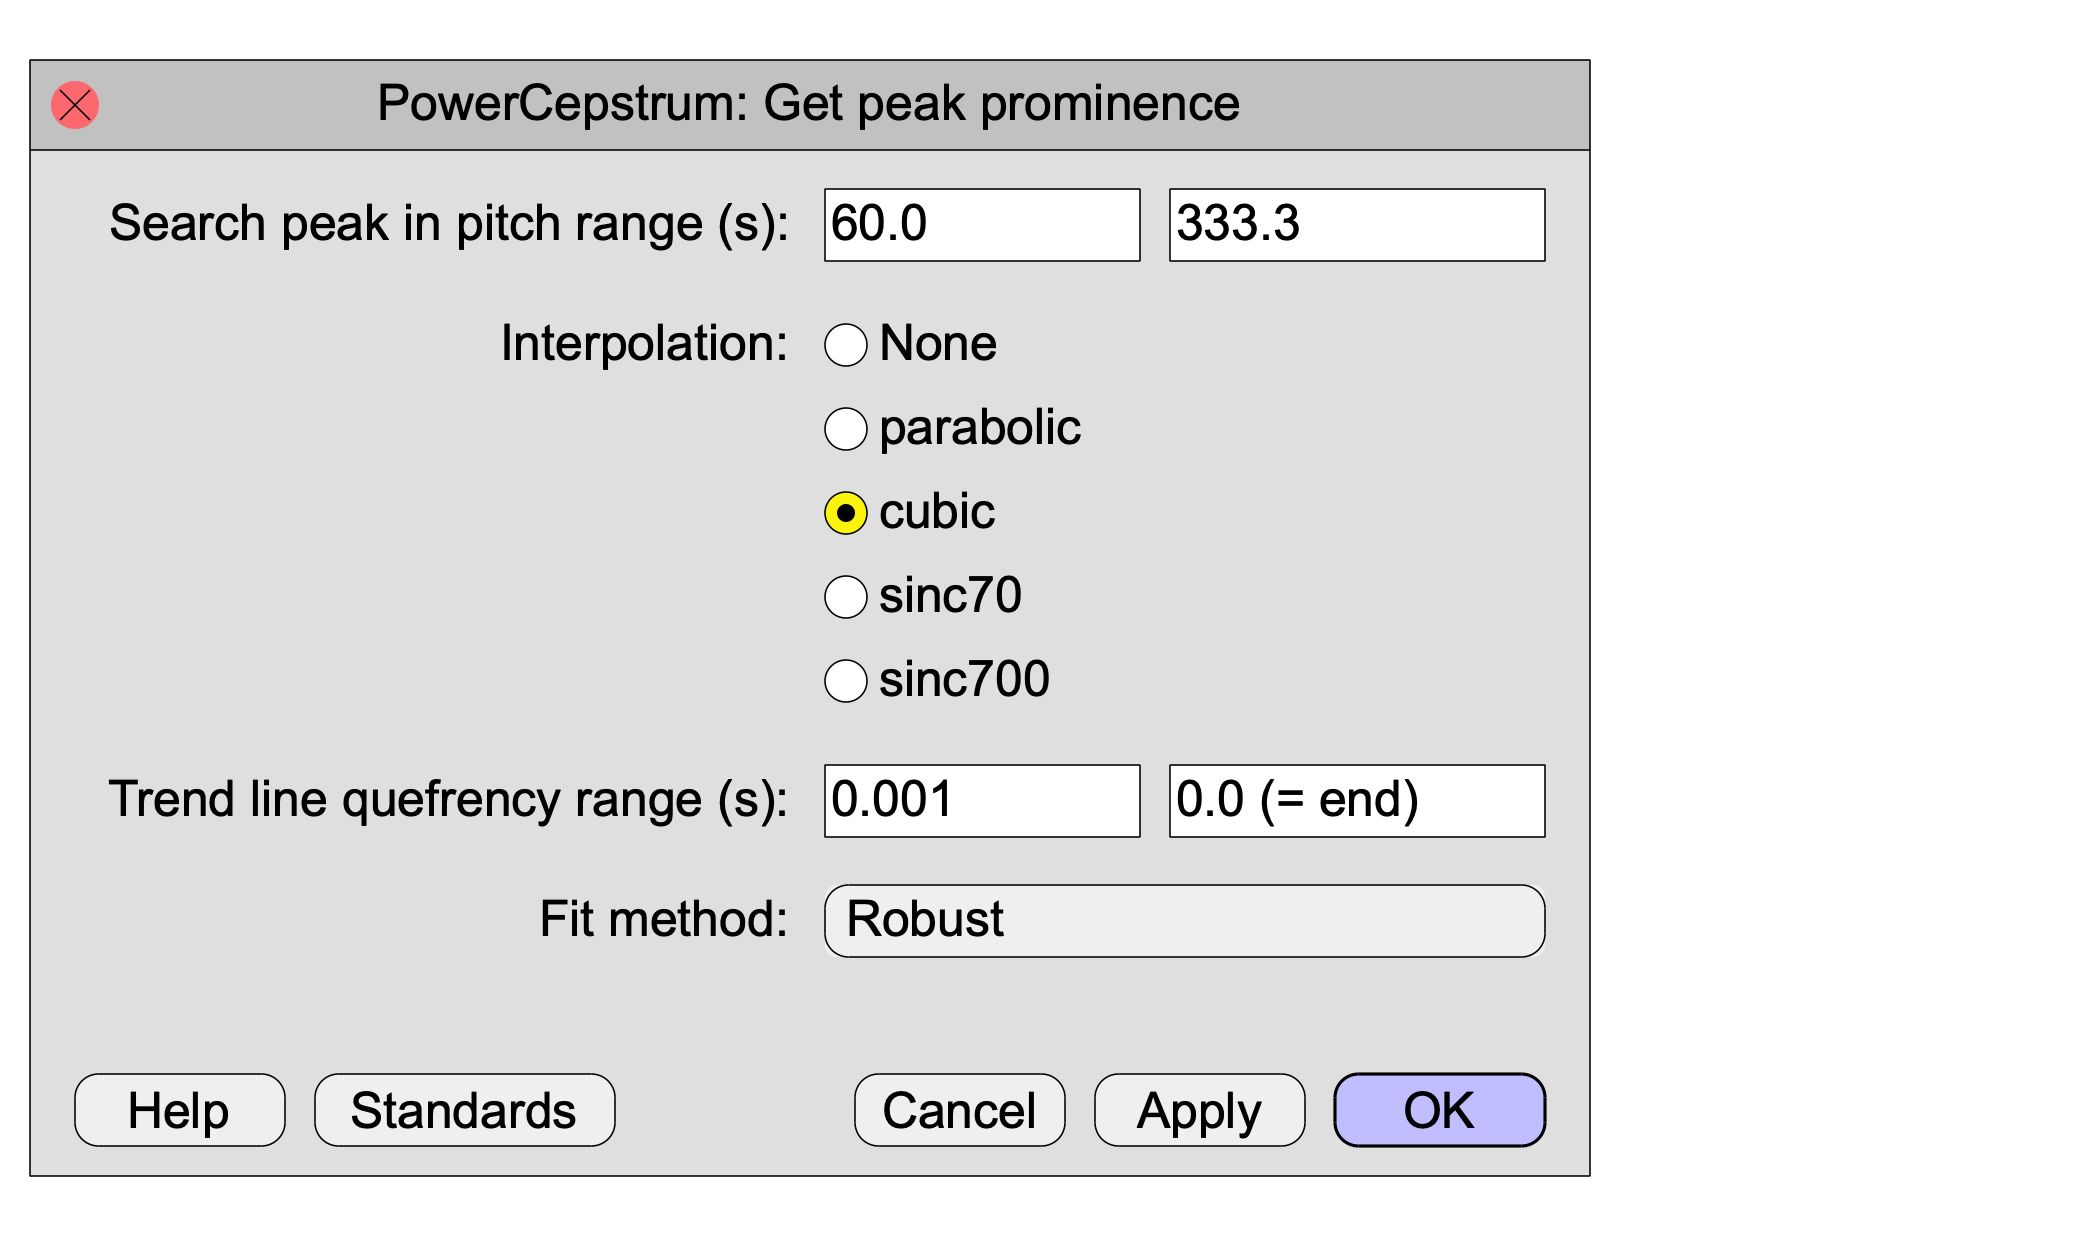
Settings
-
Search peak in pitch range
-
determine the limits of the quefrency range where a peak is searched for. The lower quefrency is determined as 1 / pitchCeiling and this value is in general more critical than the value of the upper quefrency which equals 1 / pitchFloor. A pitchCeiling of 300 Hz will correspond to a lower quefrency of 1/300≈0.0033 seconds.
-
Interpolation
-
determines how the amplitude and position of a peak are determined.
-
Trend line quefrency range
-
the quefrency range for which the amplitudes (in dB) will be modelled by a straight line. The lower value for this range in the Hillenbrand et al. (1994) article was chosen as 0.001 s in order to reduce the effect of very low quefrency data on the straight line fit. In our analysis this value is not so critical if we use the robust fitting procedure. If you choose the "Least squares" fit method then it matters more.
-
Trend type
-
defines how to model the cepstrum background. We can model it with a straight line as was done in Hillenbrand et al. (1994). The slope of this line will generally be negative because the background amplitudes get weaker for higher quefrencies. Or, we could use an exponential model in which the background cepstral amplitudes decay in a non-linear fashion.
-
Fit method
-
defines how the line that models the cepstrum background is calculated. The default method, "Robust slow", corresponds to Theil's robust line fit. The "Robust" method corresponds to the incomplete theil regression and is computationally faster but somewhat less precise. To be compatible with the past, a standard least squares line fit can also be chosen but it is much less precise than the other two because a least squares fit is much more influenced by the peak cepstral values than the other two.
Examples
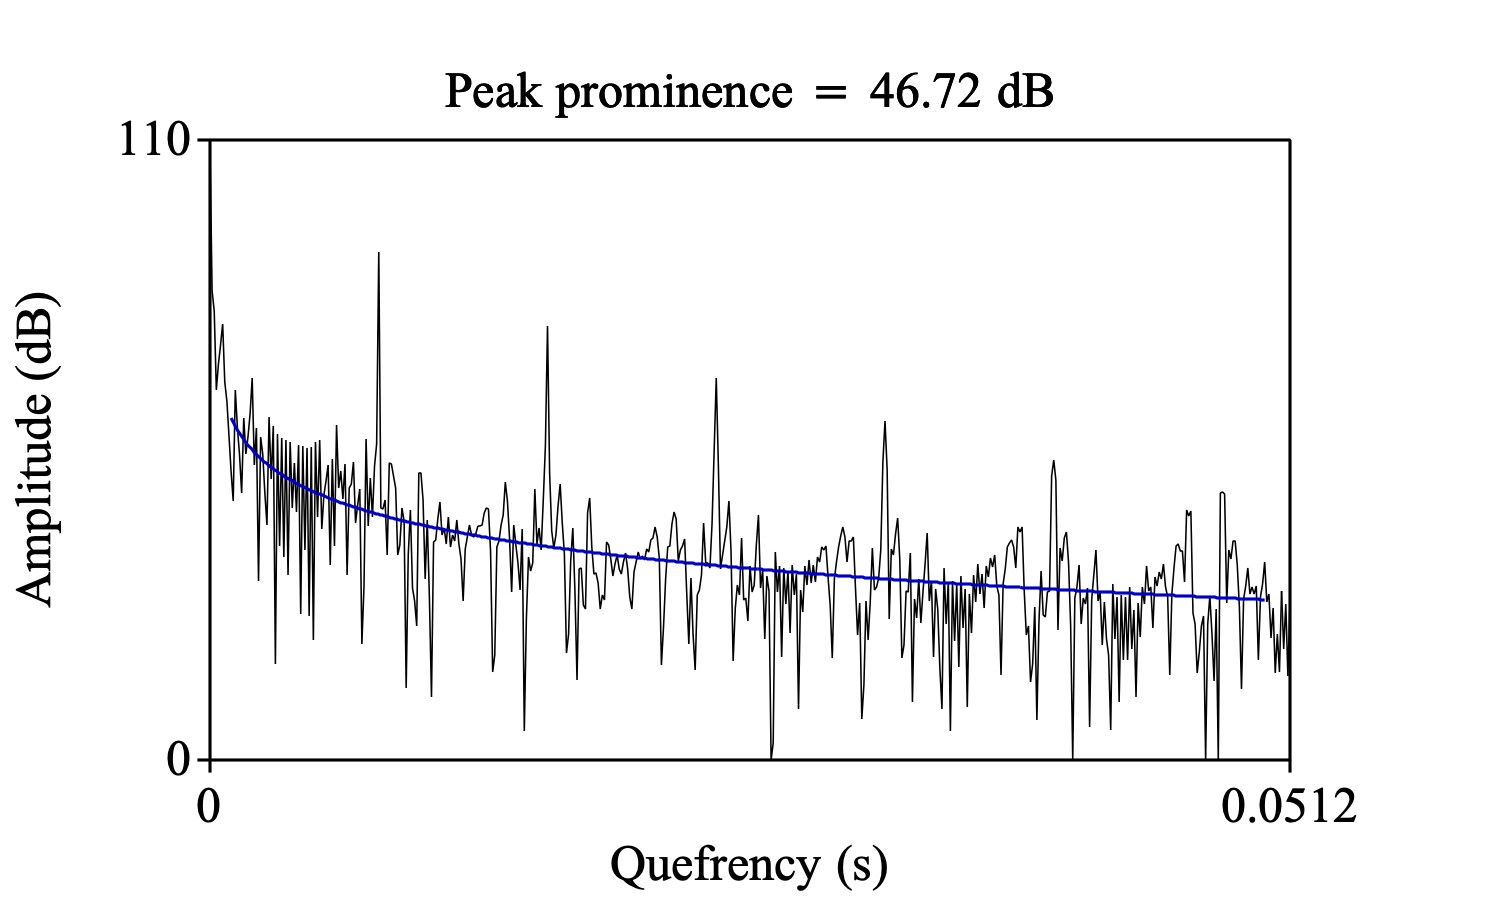
Next picture of a PowerCepstrum with its straight blue trend line and its corresponding peak prominence value was generated with the following script. Note that the first four lines in the script are only necessary to generate a PowerCepstrum of a part of a vowel.
Create KlattGrid from vowel: "a", 0.3, 125, 800, 80, 1200, 80, 2300, 100, 2800, 0.1, 1000
To Sound
To PowerCepstrogram: 60, 0.002, 5000, 50
To PowerCepstrum (slice): 0.1
prominence = Get peak prominence: 60, 333.3, "parabolic", 0.001, 0.05, "straight", "robust slow"
Text top: "no", "Peak prominence = " + fixed$ (prominence, 2) + " dB"
Draw: 0, 0, 0, 110, "yes"
Colour: "blue"
Draw trend line: 0, 0, 0, 110, 0.001, 0.05, "straight", "robust slow"
Colour: "black"
Text top: "no", "Peak prominence = " + fixed$ (prominence, 2) + " dB"

In the next picture the trend line is of exponential decay type and consequently the peak prominence value has changed a little bit.
Links to this page
© djmw 20190912