Analysis of context-dependent segmental duration
for automatic speech recognition

Xue Wang, Louis C. W. Pols & Louis F. M. ten Bosch*

Institute of Phonetic Sciences / IFOTT, University of Amsterdam,
Herengracht 338, nl-1016 CG Amsterdam, the Netherlands, e-mail: wang@fon.let.uva.nl
*Lernout & Hauspie Speech Products N.V., Brussels, Belgium

ABSTRACT

This paper presents statistical analyses of context-dependent phone durations using the hand-segmented TIMIT database, for the purpose of improving automatic speech recognition. Two main approaches were used. (1) Duration distributions were found under the influence of individual contextual factors, such as broader classes specified by long or short vowels, word stress, syllable position within the word and within an utterance, post-vocalic consonants, and utterance speaking rate. (2) A hierarchically structured analysis of variance was used to study the numerical contributions of 11 different contextual factors to the variation in duration.
Several systematic effects were found, whereas several others were obscured by the inherent variability in this speech material. We suggest to implement this knowledge in the post-processing phase of a recogniser.

1. introduction

Many phoneticians feel challenged by the surprisingly high performance of several HMM- and/or ANN-based continuous automatic speech recognition (ASR) systems. In a probabilistic approach, the possible invariance and the apparent variability problem is mainly handled by systematically analysing large data sets, in which all possible sources of variation are properly represented, and by subsequently producing distributions and probabilities. However, for instance, for well-articulated stressed vowels, a more peripheral spectral quality, a more extended formant transition, a longer duration, and a higher energy, are evident compared to those characteristics for similar but unstressed vowels. Such effects are not just accidental but are rather consistent and predictable. This specific knowledge could perhaps be added to the statistically defined general knowledge (provided by the structure of the conventional monophone-based HMM recognisers), in an attempt to improve the overall system performance. Context-dependent segmental duration is one of such specific knowledge sources.

In this study, we present detailed analyses on segmental (phone) durations as influenced by several important contextual factors. First duration distributions for such individual factors are presented. Then an adapted ANOVA is used to study the systematic contributions of the 11 factors under concern. In order to make the analysis results useful for improving ASR performance, the speech database chosen should be somehow close to the real-life situation e.g. it must be continuous speech of many speakers. Yet for analysis purposes it must be fully hand-labelled. That's why we chose the TIMIT database which has been used for many related studies (e.g. [5], [14], [6]). In the present study the data set used contains all 3,696 si and sx utterances (4,891 different words) of the TIMIT training set, spoken by 462 speakers (326 male/136 female).

2. Phone duration distributions

Fig. 1 gives the duration distribution of all 134,627 non-silent phone segments (with the 3 closure types included) in the 3,696 training utterances. The distribution of one example phone together with its phone duration pdf modelled by a monophone HMM in our recogniser [13] is also given.
Figure 1: Histograms (bars, in 8 ms bins) for the whole data set (left) and for the phone /aa/ (right), together with the HMM modelled pdf. "Count" is the number of phone instances.

It is important to keep in mind that there are actually at least three types of phone sequences per utterance:
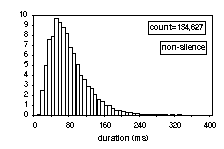
  1. 1. The hand-labelled sequence with 142,910 segments, of which 8,283 are long pauses, leaving 134,627 real phone (and closure) segments;
  2. 2. The lexical form, representing the ideal or norm pronunciation of each word in isolation. Stringing these word pronunciations together to form utterance pronunciations, produces a larger number of segments (154,133), of which 7,392 are pauses, leaving 146,741 phone (and closure) segments. Of the total of 12,114 deleted phones, 7,272 are non-released stop bursts, and 3,237 are closures. This is a substantial part of all deletions (86.8 %);
  3. 3. The one resulting from the actual automatic word or phone recognition (forced Viterbi).
For the whole data set, only 78.2 % phone instances in the lexicon (120,599 out of 154,133) are completely correctly matched with the hand-labelled realisations, after applying appropriate dynamic programming (DP) (at symbolic level)! Part of the mismatches are of course related to insertions (4,322) and deletions (15,545), the rest are substitutions (17,989), partly related to alternative pronunciations and word boundary effects. This substantial discrepancy is a complicating factor in collecting duration statistics from the TIMIT database. The best we could do is to copy the syllable positions within word and within utterance, as well as the stress marks, from the lexicon onto the actual phone labels via the mapping provided by the DP.

2.1. Vowel duration distribution affected by stressing and location

In order to get more consistent representations, we will first of all distinguish long vs. short vowels (in TIMITBET notation):

short: /iy, ih, eh, ix, ax, ah, uw, uh/

long: /ae, aa, ao, ey, ay, oy, aw, ow, er/

The main effects of short vs. long vowels, stress and utterance-final lengthening are summarised in Table 1 together with data from Crystal & House [2]. All three effects (stress, vowel length, utterance position) are tangent and are potentially useful to improve automatic speech recognition performance.

        TIMIT       C. & H.      TIMIT       C. & H.     
       short V       short       long V      long V      
         (8)         V (4)        (9)          (7)       
       ms   n    ms   n   ms    n    ms   n   
 uns   60  13,9  56  842  93   3,55  84  286  
            65                  0             
 str   87  14,1  93  601  133  13,8  15  1,4  
            66                  91   1   11   
 uf    78  1,19  81  39   109  408   11   7   
 uns        9                        0        
 uf    14  954   14  78   177  1,13  20  125  
 str   2         7              5    2        
 unf   59  12,7  56  727  90   3,14  77  224  
 uns        66                  2             
 unf   83  13,2  85  253  129  12,7  13  628  
 str        12                  56   4        


Table 1: Mean vowel duration in ms and number of instances (n) for TIMIT and data of Crystal & House (C. & H.), in stressed (str) and unstressed (uns) syllables and in utterance final (uf) and non-final (unf) positions.
Table 2 presents similar subdivisions of the vowel data separated for word-final vs. non-final, whereas the duration mean for vowels in mono-syllabic words is given separately. The distinction between stressed and unstressed is still very apparent.

         short vowel                  long vowel               
      unstres     stressed     unstress     stressed     
        sed                       ed                     
      ms   n    ms    n    ms    n    ms    n   
 wf   71  5022  113  1268  97   1583  148  175  
                                            3   
nwf   55  5858  82   4728  89   1679  123  540  
                                            2   
mono  52  3085  86   8170  86   288   138  673  
                                            6   


Table 2: Mean vowel duration of TIMIT data set for word-final (wf), non-word-final (nwf) and monosyllable words (mono).
However, the effect of the position within the word is not very consistent at all, perhaps apart from the somewhat longer duration for short vowels in word-final positions.

2.2. Effect of post-vocalic plosives on vowel duration

Most phonetic handbooks tell us that in languages like English (e.g. [9]) and Dutch [7] a vowel preceding a voiced plosive is generally longer than the same vowel preceding an unvoiced plosive, and actually the reverse seems to be true for the closure time. Also in rule-based synthesis these vowel- and closure-duration features are successfully applied to improve quality and intelligibility [3]. Van Santen [12] presents very nice data for word-penultimate stressed vowel duration as a function of the post-vocalic consonant for a single male speaker in a 71-minutes database of read sentences (containing 2,162 sentences, 13,048 words, and 18,046 vowel segments). Differences in average vowel duration of about 100 ms were found for voiced vs. voiceless plosives. We wondered whether similarly consistent effects could be found for a much less homogeneous database of many different speakers such as TIMIT.

Similar to Van Santen, we limited ourselves to stressed vowels only. It was apparent that for the present database the distributions of vowels followed by voiced and unvoiced plosives are very similar indeed! Only the tails of the distributions give some indication of a lengthening effect for voiced plosives.

2.3. Effect of speaking rate on vowel duration

So far hardly any ASR system takes the systematic effect of speaking rate into account. In the 1994 Benchmark test for the ARPA Spoken Language Program clear evidence was presented [8] that speakers with a high speaking rate (in terms of number of words per minute) almost unanimously showed a higher word error rate for all 20 systems that participated in the so-called baseline Hub1 C1 test. This certainly makes it interesting to see whether rate-specific duration information could help in improving recognition performance. Jones & Woodland [4] already showed that speaking rate can be measured at recognition time and that it can be used to improve the speech recognition behaviour through e.g. post processing.

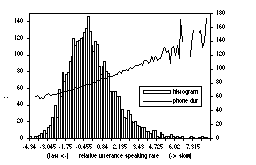
The normalised phone duration [4] is chosen as the basic unit, this way we correct for the intrinsically long or short duration of specific phones. The relative speaking rate of an utterance then is defined as the average normalised phone duration in that utterance. Actually this is more like the reciprocal of rate, since the higher that number the slower the rate. Fig. 2 gives a histogram distribution of the relative speaking rate for all 3,696 utterances. It is similar to the usual duration pdf of most phones, having a binomial-like distribution. For comparison, the utterance-averaged absolute phone durations in the corresponding histogram bins are also shown. It can be seen that the averaged absolute phone duration has a near-linear relation with the relative utterance speaking rate, this is particularly true in the middle region, where counts are large. The irregularities in the periphery are due to the fact that these represent relatively few utterances for which the intrinsic phone duration may vary a lot. We divided all sentences into the three categories fast, medium and slow, and derived phone duration distributions accordingly.


Figure 2: Histogram of the relative speaking rate for the whole data set. The dark curve represents the utterance-averaged phone duration in ms (against right axis) in each histogram bin.

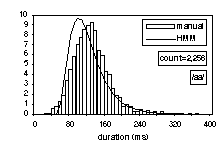
3. Hand-labelling vs. automatic segmentation

The duration statistics derived in the preceding section, were all based on the hand-labelled TIMIT material. This could be the basis for an initialisation process to add duration-specific knowledge to a recognition system. However, the HMM-based recogniser will never be able to recognise and reproduce all these phone segments with their correct duration. So, our next step is to see how close the phone durations after Viterbi search match the hand-labelled segments. If one plots the duration of the manually labelled segments against that of the segments after Viterbi search (not shown) it can be seen that the number of outliers can be quite serious. The TIMIT database has been used repeatedly to test automatic segmentation procedures (e.g. [1]) with comparable results. About 15% of the phone duration, with full knowledge of the phone sequence, deviates more than 20 ms from the actual duration. For all 50 phones together this is a rather even distribution around the diagonal, however for individual phones the deviation can be much more uneven. In any initial training based on the hand-labelled data, such deviations cannot be taken into account and perhaps should be taken care of in some later phase.

4. Analysis of variance

By studying one effect after the other, as done above, a much better view on the significance of various parameters is obtained. However, a quantitative comparison is not very well possible along those lines. Inspired by Sun & Deng [11] who analysed the spectral variability using TIMIT, we have developed a hierarchically structured Analysis of Variance (ANOVA), that in principle should make it possible to analyse the contribution of various identifiable factors to the overall durational variability in the TIMIT database.

There is no straightforward ANOVA that can solve this problem, the complications lie at various levels: * the inability to model this complex factorial design in a fully satisfactory way;

* the sheer size of the data, which leads to memory problems;

* the problem of nested factors;

* empty cells and singletons;

* the ordering problem.

We intend to analyse the variation in phone duration as explained by the following 11 factors:

R   speaking rate    L   syllable location   
                     u     in utterance      
C   broad phonetic   G   gender of speaker   
l       class                                
P       phone        D   dialect region of   
h                    r        speaker        
P  phone in context  S        speaker        
t                    p                       
S       stress       S     phone segment     
                     g                       
L      syllable                              
w  location in word                          

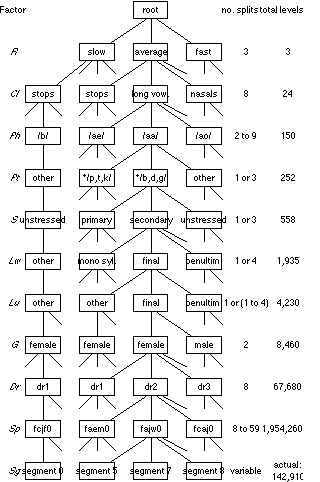
Each factor has a different number of levels and some of these numbers have complicated relations with others. The relations between all the levels in all the 11 factors can be shown in a tree, part of which is represented in Fig. 3.

The result of calculating the sum-of-squares (SS) terms in percentages in each of the subsequent 11 factors is shown in Table 3 for two different orderings of the factors. The most tangent phenomenon seen from these percentages is, that when Sp (and G and Dr) are put before Cl and Ph (see lower section of Table 3), the variation in Sp is rather small, while when Sp (and G and Dr) are put after the splitting of the data by Cl and Ph, Sp explains a much larger percentage of variation.

R   Cl  Ph  Pt  S   Lw  Lu  G   Dr  Sp  Sg  los  
                                             s   
2.  15  26  0.  0.  0.  0.  0.  2.  16  34  0.8  
3   .1  .0  2   4   8   9   3   2   .0  .9       
R   G   Dr  Sp  Cl  Ph  Pt  S   Lw  Lu  Sg  los  
                                             s   
2.  0.  0.  0.  19  37  1.  1.  1.  0.  34  0.7  
3   0   0   6   .6  .5  1   2   5   6   .9       


Table 3: Percentages of variations in terms of SS in the 11 factors calculated from the whole data set. The upper and lower sections show two different ordering of the factors. The last column shows the loss of calculated SS due to singleton cells.
For the moment we suppose that the upper row of percentage numbers given in Table 3, properly reflects the importance of various factors, in terms of variation explained. However, this puts us in a somewhat uneasy position, since several factors that appeared to have a consistent effect in the distributions presented in sect. 2, such as speaking rate R and stress S, here are only responsible for 2.3% and 0.4%, respectively! A possible explanation for these discrepancies is that any ANOVA can only present overall effects per factor, whereas for instance in Table 1 the effect of stress is presented for long and short vowels separately. In a regular ANOVA such effects show up in interaction terms, which are not available in the present analysis.
Figure 3: Part of the tree for ANOVA for the 11 indicated factors. Also the number of possible splits of levels per factor, as well as the cumulative numbers of levels, are indicated.

5. discussion

It strikes us that so many of the very consistent facts that Van Santen [12] could demonstrate in his large speech database for a single male speaker did not show up in the multi-speaker TIMIT database. It made us aware once again that `real speech', although still read from paper, and `non-professional speakers' under semi-controlled conditions introduce a lot of variation. As a consequence, only certain duration features may be beneficial for improving recognition performance. We will continue that search, and we hope that the methodology that we have applied so far, may show to be productive for other specific knowledge sources, such as pitch, as well. Meanwhile, in our research project about duration modelling, we build duration models based on a subset of all the contextual factors discussed in this work, and integrate them into the post-processing part of the recogniser using N-best sentence alternatives [13]. A more extended version of this paper will be published in [10].

6. REFERENCES